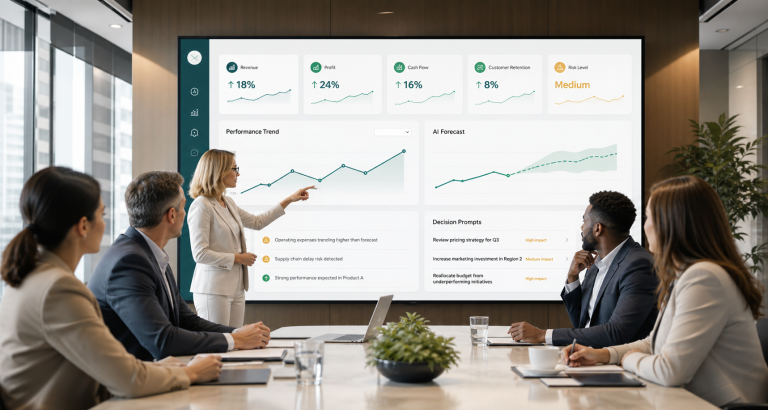

Predictive analytics can improve business decisions only when it is tied to real choices, clear data, and measurable action. Many companies already collect enough information to see what may happen next, yet their teams still rely on monthly reports, instinct, and delayed feedback. That gap creates slow decisions. It also causes leaders to notice risk after customers leave, inventory piles up, budgets slip, or sales opportunities cool down.
At its best, predictive analytics does not replace human judgment. Instead, it gives decision-makers a sharper view of likely outcomes before they commit time, money, or staff. A forecast can show which leads are most likely to convert. Risk models can highlight accounts that may churn. Demand forecasts can help operations prepare stock and capacity. Because the insight arrives earlier, the business can act before the result becomes obvious in the numbers.

What Predictive Analytics Means in Business
Predictive analytics uses historical and current data to estimate future outcomes. It often combines statistics, machine learning, pattern recognition, forecasting, and business rules. However, the business value comes from applying those predictions to specific decisions. A model that predicts demand is useful only if purchasing, staffing, marketing, or finance teams can use that forecast.
In practical terms, predictive analytics answers questions such as which customers may buy again, which projects may run late, which invoices may go unpaid, which products may sell next month, or which branches may need more staffing. These questions matter because they affect cash flow, customer experience, operational planning, and growth. Therefore, predictive analytics should be designed around decisions, not around dashboards alone.
Why Reports Alone Are Not Enough
Traditional reporting explains what already happened. It shows sales last quarter, ticket volume last week, campaign performance last month, and expenses by department. Those numbers are necessary, but they can keep teams in a reactive pattern. By the time a manager sees the problem, the best moment to influence the outcome may already be gone.
Predictive analytics adds a forward-looking layer. Instead of only asking what happened, teams can ask what is likely to happen next and what should be done now. As a result, marketing can adjust spend before a campaign underperforms. Sales can focus on opportunities with stronger buying signals. Service teams can intervene before customers churn. Operations can plan capacity before demand spikes.
Where Predictive Analytics Improves Decisions
Sales teams can use predictive analytics to prioritize leads, forecast pipeline, identify stalled deals, and recommend next actions. For example, a model may compare industry, company size, engagement history, website activity, previous conversations, and deal stage to estimate conversion likelihood. Then the CRM can surface the strongest opportunities first.
Customer success teams can use it to predict churn, renewal risk, support escalation, or upsell readiness. Meanwhile, finance teams can estimate cash flow, late payment probability, fraud risk, and budget variance. Operations leaders can forecast demand, staffing needs, delivery delays, maintenance issues, and supply shortages. In each case, the prediction should lead to a better next step.
The Decision Loop That Makes Predictions Useful
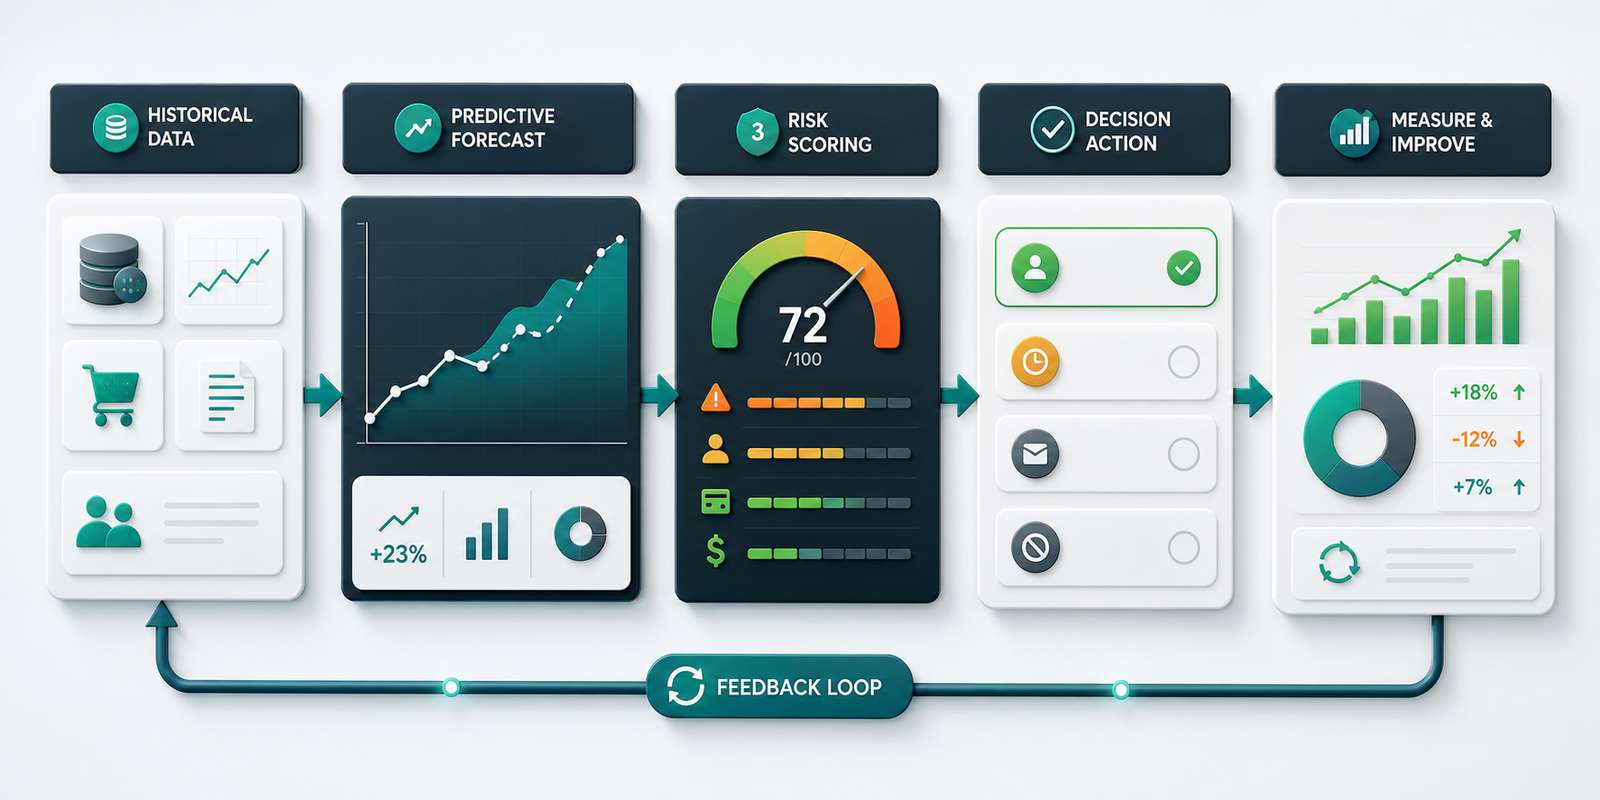
A useful predictive workflow has five parts. First, the business defines the decision that needs support. Next, the system gathers reliable data from sources such as CRM records, ecommerce activity, support tickets, finance tools, project systems, and website behavior. After that, the model estimates a likely outcome. Then the prediction is delivered to the team inside a tool they already use. Finally, the business measures whether the recommended action improved the result.
This loop matters because predictions decay when they are disconnected from feedback. A sales forecast must learn from won and lost deals. Churn models must learn from renewals, cancellations, complaints, and customer usage. Demand models must learn from real inventory movement. Consequently, predictive analytics should be treated as a living workflow, not a one-time report.
Reactive Reporting vs Predictive Analytics
| Decision area | Reactive reporting | Predictive analytics |
|---|---|---|
| Sales pipeline | Shows closed deals and current stage totals | Estimates which deals are likely to close and which need attention |
| Customer retention | Reports cancellations after they happen | Flags accounts with churn risk before renewal dates |
| Inventory planning | Reviews past stockouts or overstock | Forecasts demand patterns so stock decisions happen earlier |
| Finance management | Tracks overdue invoices and budget changes | Predicts payment risk and future cash flow pressure |
| Operations | Summarizes delays and workload after the period ends | Highlights capacity risk and likely bottlenecks in advance |
The difference is not just timing. Reactive reporting often tells teams where to investigate. Predictive analytics helps teams choose what to do next. Therefore, the strongest projects connect predictions with workflow rules, alerts, owner assignments, and follow-up measurement.

Data Sources That Improve Forecast Quality
Good predictions depend on data that reflects the real business process. Sales models may need lead source, deal size, activity history, response time, meeting notes, buyer role, and product interest. Churn models may need support history, product usage, account age, billing changes, satisfaction scores, and renewal dates. Demand models may need seasonality, promotions, pricing, geography, stock levels, and external market factors.
More data is not always better. If a dataset is outdated, duplicated, biased, or unrelated to the decision, it can weaken the model. For that reason, businesses should start with the data that is already trusted by the teams who own the process. Then they can add new signals as the workflow matures.
How Predictive Analytics Supports Better Judgment
Leaders sometimes worry that analytics will make decisions too mechanical. In reality, the best use is decision support. Predictive analytics can rank risk, estimate probability, and show the factors behind a recommendation. However, managers still apply context, customer knowledge, ethics, market conditions, and strategic priorities.
For instance, a model may show that a customer has high churn risk. The account manager may know that the customer is changing leadership and needs a personal check-in. Similarly, a forecast may show higher demand next month, but operations may know that a supplier is delayed. When predictions and human judgment work together, decisions become faster and more grounded.
Helpful Internal and External Resources
Businesses preparing for predictive analytics usually need connected data, automated workflows, and clear implementation steps. Zevanta Digital’s AI automation services can help connect predictions to daily business actions. The implementation process explains how projects can move from discovery to deployment. Teams can also review the broader services page or explore case studies before planning a predictive workflow.
Several technology providers explain the same core idea from different angles. Google Cloud describes predictive analytics as using data to forecast future outcomes. AWS explains how predictive analytics can reduce decision risk and guide strategic choices. In addition, IBM connects predictive analytics with statistical modeling, data mining, and machine learning.
Step-by-Step Guide to Start Predictive Analytics
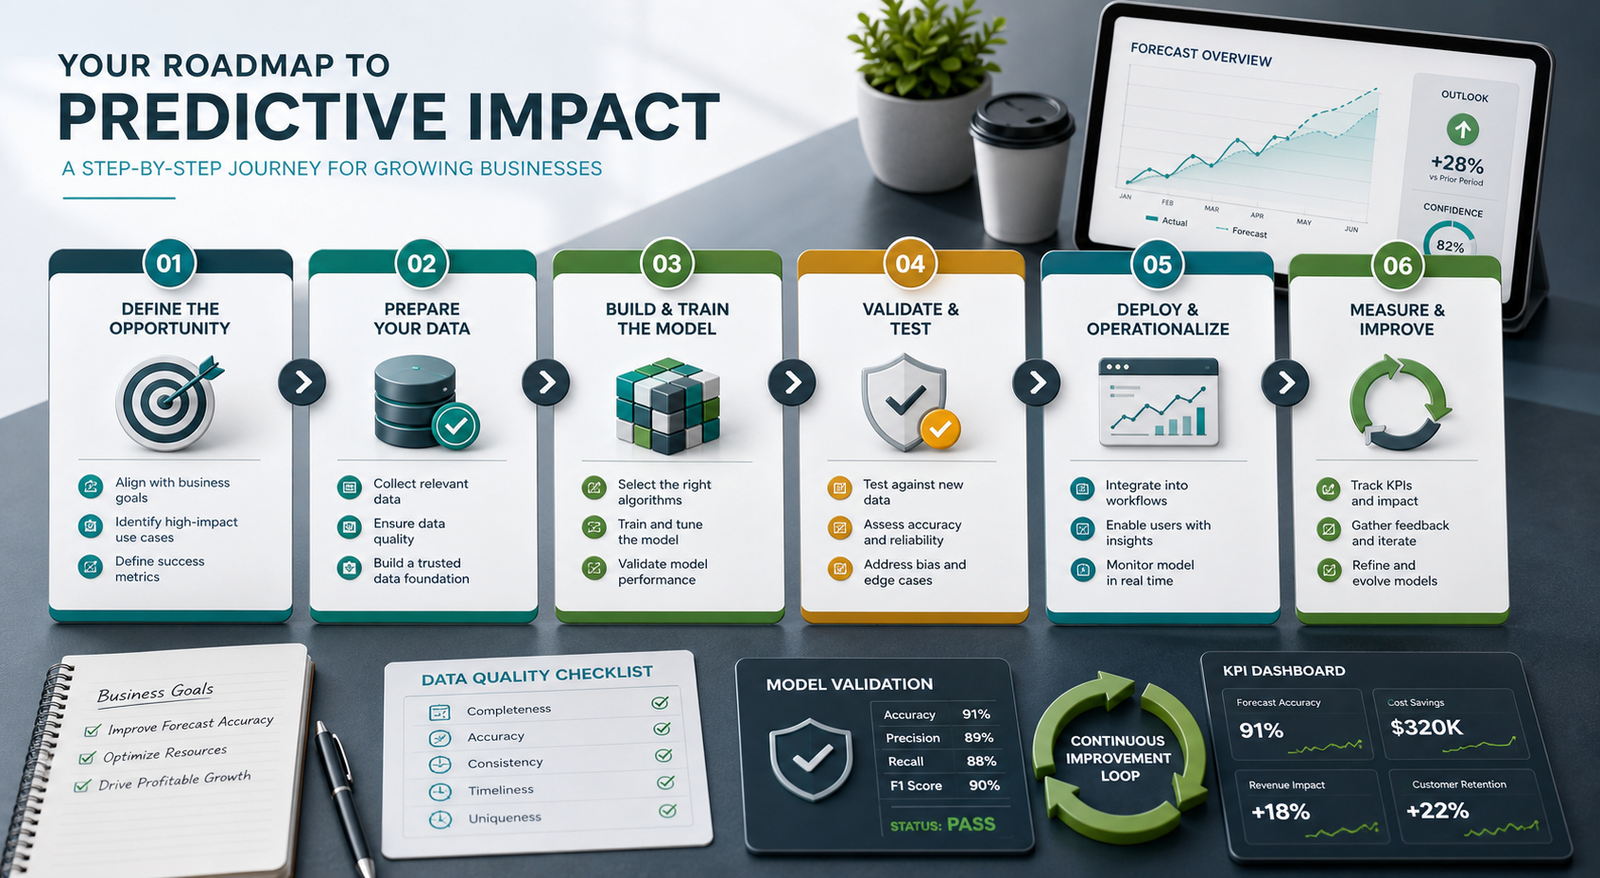
Step 1: Choose one decision with clear business value. Start with a question that affects revenue, cost, retention, productivity, or customer experience. Strong examples include which leads should sales call first, which customers may churn, which products need more inventory, or which invoices may become late.
Step 2: Define the action that follows the prediction. A score is not enough. Decide what happens when a lead is high intent, an account is high risk, or demand is likely to rise. This may create a task, send an alert, adjust a forecast, or start a review process.
Step 3: Audit the available data. Identify where the needed information lives, who owns it, how accurate it is, and how often it updates. Also check whether important outcomes are recorded consistently. Without reliable outcome data, the model cannot learn what success looks like.
Step 4: Build a simple first model. Early predictive analytics does not need to be overly complex. A practical model that ranks risk or probability can create value quickly. Later, the business can add more variables, stronger validation, and advanced machine learning methods.
Step 5: Test predictions against real outcomes. Before relying on the model, compare its predictions with what actually happens. This helps the team understand accuracy, false positives, false negatives, and where human review should remain involved.
Step 6: Put predictions inside the workflow. Employees should not need to open a separate analytics portal just to use a forecast. Instead, predictions should appear inside the CRM, help desk, operations dashboard, finance system, or management report where decisions already happen.
Step 7: Measure business impact. Track whether decisions became faster, more accurate, or more profitable. Useful metrics include conversion lift, churn reduction, forecast accuracy, fewer stockouts, lower manual review time, improved collection rates, and better resource utilization.
Benefits for Growing Businesses
The first benefit is earlier action. When teams can see likely outcomes sooner, they can prevent avoidable losses and capture opportunities faster. Another benefit is better prioritization. Instead of treating every lead, account, ticket, or invoice the same way, employees can focus attention where it matters most.
Predictive analytics can also improve planning. Forecasts help leaders prepare staffing, stock, budgets, campaign spend, and capacity with more confidence. Furthermore, it can improve customer experience by identifying needs before customers complain. Over time, these improvements can turn analytics into a practical operating advantage rather than a reporting exercise.
Common Mistakes That Weaken Predictive Analytics
One common mistake is building a model without defining the decision it supports. If no team knows what action to take, the prediction becomes interesting but useless. Another mistake is chasing complexity too early. A simpler model with clear workflow adoption may outperform a complex model that nobody trusts or uses.
Some businesses also ignore data quality. Missing fields, inconsistent labels, weak outcome tracking, and siloed systems can damage accuracy. Additionally, teams may forget to monitor models after launch. Markets change, customer behavior shifts, and internal processes evolve. Because of that, predictive analytics needs ongoing review, not a set-and-forget mindset.
How Zevanta Digital Helps Your Business
Zevanta Digital helps businesses design predictive analytics workflows that lead to action. First, the team identifies decisions where better forecasting can improve revenue, retention, cost control, or operational speed. Next, data sources are reviewed for quality and availability. After that, the workflow is designed around predictions, owner assignments, alerts, review steps, and performance tracking.
This approach keeps predictive analytics practical. Rather than building a dashboard that people admire but ignore, Zevanta Digital can help connect predictions to the tools teams already use. As a result, sales, service, operations, and leadership teams can act on forecasts with less friction. For businesses ready to explore a use case, the contact page is the simplest next step.
What to Measure After Implementation
Measurement should focus on decision quality, not only model accuracy. A forecast can be statistically strong and still fail if nobody uses it. Therefore, track adoption, response time, action completion, financial impact, and user trust. Also compare outcomes between teams or periods where predictions were used and where they were not.
Important metrics may include forecast accuracy, conversion rate, churn rate, average handle time, stockout frequency, late payment reduction, backlog size, campaign efficiency, and revenue influenced. Once the first use case proves value, the business can expand predictive analytics into another workflow with less risk.
Frequently Asked Questions
What is predictive analytics?
Predictive analytics uses historical and current data, statistics, and machine learning to estimate future outcomes. Businesses use it to forecast risk, demand, customer behavior, sales performance, and operational needs.
How does predictive analytics improve decisions?
It improves decisions by giving teams earlier signals about likely outcomes. Leaders can prioritize work, prevent risk, prepare resources, and choose actions before problems or opportunities become obvious.
Which departments can use predictive analytics?
Sales, marketing, finance, customer success, operations, HR, supply chain, and leadership teams can use predictive analytics. The best starting point is usually a repeated decision with measurable business impact.
Does predictive analytics require perfect data?
No, but it does require relevant and reliable data. Teams should clean obvious errors, define outcomes consistently, and start with trusted sources before expanding the model.
Is predictive analytics the same as AI?
Not exactly. Predictive analytics is a business analytics approach. It may use AI and machine learning, but it can also use statistical models and forecasting methods depending on the use case.
How should a business start with predictive analytics?
Start with one high-value decision, define the action that follows the prediction, audit the data, test a simple model, place the output inside a workflow, and measure the business result.
How can Zevanta Digital help my business?
Zevanta Digital can help identify predictive analytics use cases, connect data sources, design decision workflows, add review steps, and measure whether forecasts improve real business outcomes.