

AI dashboards can give executives a faster way to understand what matters, but only when they are designed around real decisions. Many companies already have dashboards, reports, spreadsheets, and analytics tools. However, leadership teams still waste time asking basic questions: which numbers changed, why did they change, who owns the issue, and what should happen next? When a dashboard cannot answer those questions quickly, executives stop using it.
The best AI dashboards do more than display charts. They summarize business performance, highlight unusual changes, explain likely causes, forecast near-term outcomes, and recommend where leaders should focus. Instead of forcing executives to dig through dozens of tabs, the dashboard becomes a decision layer. As a result, meetings become clearer, priorities become easier to compare, and follow-up work becomes more accountable.
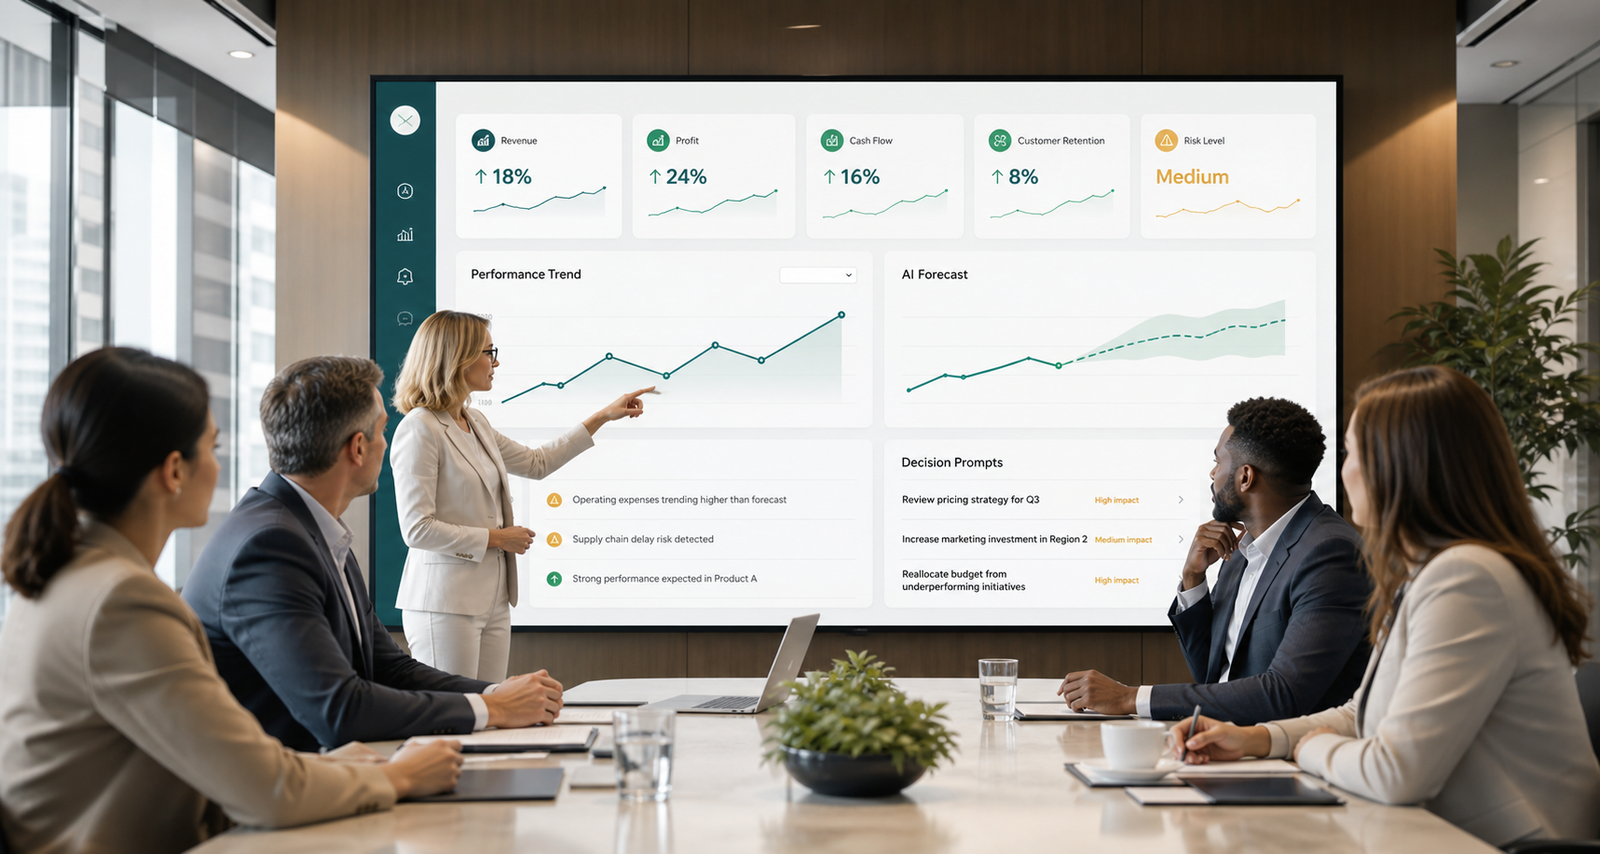
What Makes AI Dashboards Different
A normal dashboard shows selected metrics in a visual format. It may include charts, tables, filters, and alerts. An AI dashboard adds intelligence around those metrics. For example, it can detect anomalies, summarize patterns in plain language, connect data from multiple systems, surface likely causes, and forecast future movement. Because of that, the dashboard becomes more useful for decision-making, not just reporting.
Executives usually do not need every detail. They need confidence, context, and direction. A useful dashboard shows whether the business is on track, where risk is building, which opportunity deserves attention, and what action should be assigned. Therefore, the design must start with executive decisions rather than available data fields.
Why Executives Ignore Most Dashboards
Dashboards often fail because they are built for analysts, not leaders. They include too many charts, too many filters, and too much raw detail. Meanwhile, the most important story is buried under visual noise. Executives may open the dashboard once, feel overwhelmed, and return to asking someone for a summary.
Another problem is weak ownership. A dashboard may show that customer churn increased, but it may not show who is responsible for the response. Likewise, it may show that revenue is behind target without explaining whether the issue came from pipeline volume, conversion rate, pricing, retention, or delivery capacity. When a dashboard creates more questions than answers, it does not become part of the leadership rhythm.
What Executives Actually Need to See
Leadership dashboards should focus on a small set of business-critical signals. These may include revenue, gross margin, cash position, customer retention, pipeline health, operational capacity, delivery risk, employee utilization, customer satisfaction, and strategic initiative progress. Still, the exact list depends on the company’s goals and operating model.
The dashboard should also explain movement. If revenue is up, executives need to know whether growth came from new customers, expansion, pricing, seasonality, or one large deal. If profit is down, leaders need to see cost pressure, discounting, delivery inefficiency, or customer mix. In addition, the dashboard should show whether the issue is temporary, recurring, or likely to grow.
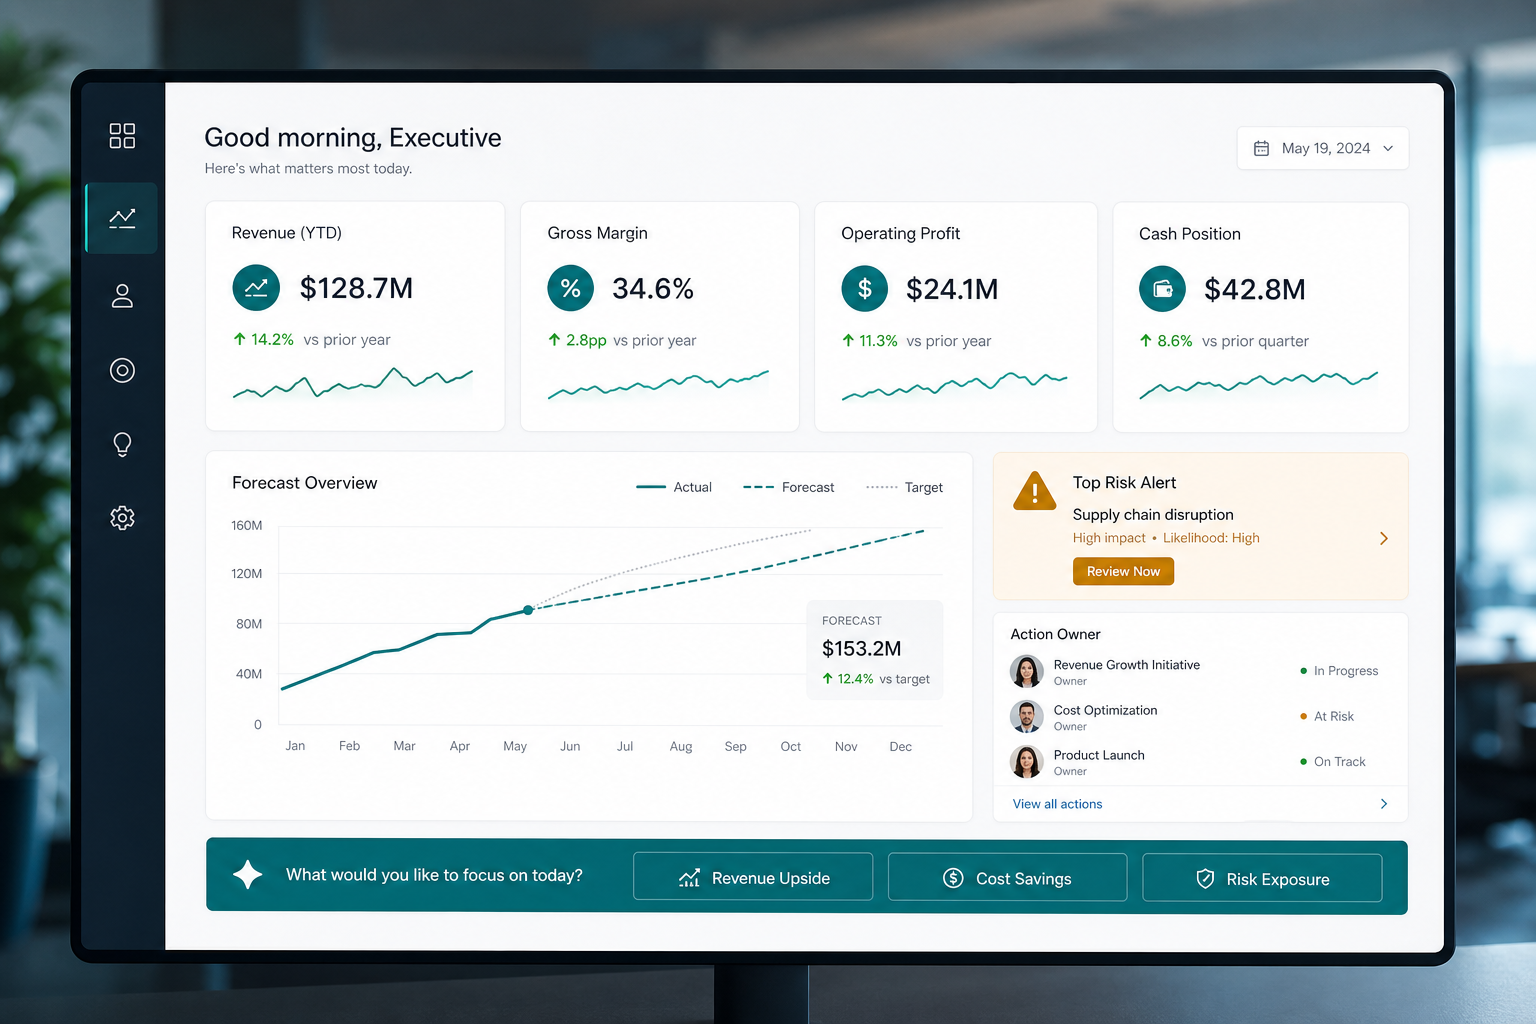
Core Features of AI Dashboards Executives Use
Useful AI dashboards usually include five practical features. First, they show a concise executive summary that explains what changed since the last review. Next, they highlight risk and opportunity based on thresholds, trends, and forecasts. After that, they connect each issue to likely drivers, such as lead quality, response time, inventory pressure, or support volume.
Then, the dashboard recommends next actions or at least shows clear options. Finally, it tracks ownership and follow-through. This matters because executives do not need another place to admire charts. They need a system that helps the team decide, assign, and measure action.
AI Dashboard vs Traditional Dashboard
| Dashboard area | Traditional dashboard | AI dashboard |
|---|---|---|
| Executive summary | Requires leaders to interpret charts manually | Summarizes key changes, risks, and opportunities in plain language |
| Metric selection | Often includes every available KPI | Focuses on decision-critical signals by role and priority |
| Trend analysis | Shows historical movement | Explains patterns and forecasts likely future outcomes |
| Root-cause support | Depends on manual investigation | Connects metric changes to likely drivers across systems |
| Follow-up | Usually happens outside the dashboard | Links insights to owners, tasks, alerts, and action tracking |
This comparison shows why AI dashboards are valuable when they reduce executive effort. A traditional dashboard may answer what happened. An AI dashboard should help explain why it happened, what may happen next, and which action deserves attention now. Therefore, the strongest dashboard is not the one with the most charts. It is the one that improves the next decision.

Where AI Dashboards Create Business Value
AI dashboards can help sales leaders understand pipeline quality, forecast risk, deal velocity, lead conversion, and rep activity. For service leaders, dashboards can summarize support backlog, customer sentiment, escalation risk, response time, and recurring complaints. Finance leaders can track cash flow, budget variance, margin changes, late payment risk, and unusual spending patterns.
Operations teams can use dashboards to monitor workload, delivery timelines, inventory, staffing, supplier risk, and process bottlenecks. Meanwhile, executives can combine these views into one leadership cockpit. Instead of opening separate reports for every department, they can compare company health across revenue, customers, operations, people, and cash.
Connecting Dashboards to Real Workflows
A dashboard becomes more valuable when it connects to business workflows. For example, a churn alert should create an account review. Delayed project warnings should notify the operations owner. Margin declines should trigger a pricing or delivery review. Forecasted cash gaps should create a finance planning task. Without these links, the dashboard may still be useful, but it depends too much on memory and meeting notes.
Zevanta Digital’s AI automation services help businesses connect insights to action. The implementation process can also help teams map which executive decisions need better visibility first. For companies comparing broader options, the services page explains how automation, integrations, and reporting workflows can work together. Teams can also review case studies before planning their own dashboard roadmap.
Authoritative analytics platforms reinforce the same idea. Microsoft Power BI explains dashboards as visual views that monitor important information. Tableau describes business intelligence dashboards as tools for tracking and understanding data. In addition, Google Looker documents dashboard use for organizing visualizations, while IBM Cognos Analytics highlights AI-assisted analytics and reporting.
Step-by-Step Guide to Build AI Dashboards Executives Use
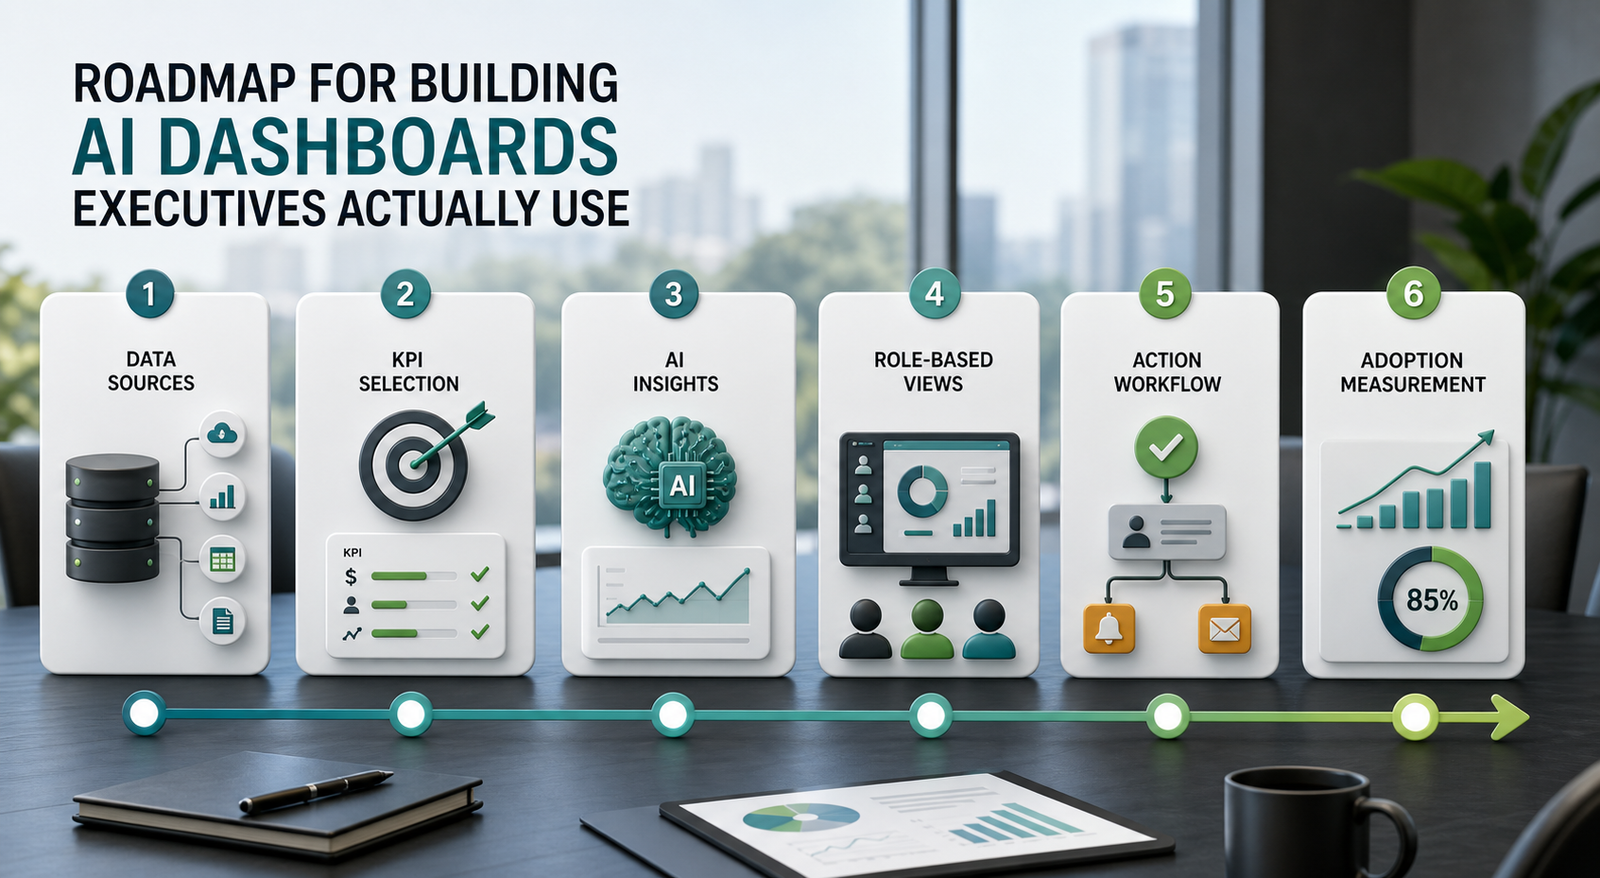
Step 1: Start with executive decisions. Before choosing charts, list the decisions leadership makes every week or month. These may include where to invest, where to cut costs, which customers need attention, which teams need support, or which risks require escalation.
Step 2: Choose a small set of core KPIs. Select metrics that directly support those decisions. Avoid adding every available number. A useful executive dashboard often has fewer metrics than a department report because its purpose is clarity.
Step 3: Connect trusted data sources. The dashboard may need CRM, finance, support, operations, marketing, project, and product usage data. However, the first version should use sources that are accurate enough for leadership decisions.
Step 4: Add AI summaries and anomaly detection. The dashboard should explain important changes in plain language and flag unusual movement. This helps executives understand what deserves attention before they open a detailed report.
Step 5: Include forecasts and scenarios. Leaders need to see likely outcomes, not only past results. Therefore, revenue forecasts, churn risk, capacity projections, and cash flow trends can make the dashboard more useful.
Step 6: Link insights to owners and tasks. Every major risk or opportunity should have an owner, status, and next step. Afterward, executives can review progress instead of repeating the same discussion.
Step 7: Measure adoption and decision impact. Track whether leaders open the dashboard, use it in meetings, assign actions from it, and make faster decisions. Once adoption is strong, add more advanced AI features gradually.
Key Benefits of Executive AI Dashboards
- Faster leadership meetings because the top issues are already summarized
- Clearer priorities across revenue, customers, operations, finance, and people
- Earlier risk detection through forecasts, anomalies, and trend changes
- Better accountability because insights connect to owners and next steps
- Less manual reporting work for analysts and department managers
- More consistent decisions because leaders use the same trusted view
These benefits appear when the dashboard becomes part of the operating rhythm. If leaders review it before meetings, use it during decisions, and assign actions from it afterward, the dashboard becomes a management tool rather than a reporting archive.
Common Mistakes to Avoid
One common mistake is designing the dashboard from the database outward. This creates a screen full of available metrics instead of useful decisions. A better approach is to begin with leadership questions and work backward to the data. Another mistake is giving every executive the same view. A CEO, CFO, COO, and sales leader may need different levels of detail.
Some teams also add AI summaries without checking data quality. If the underlying data is wrong, the summary can create false confidence. Likewise, businesses may launch a dashboard without a meeting routine, owner process, or adoption plan. Consequently, even a well-designed dashboard can sit unused because nobody changed how decisions are made.
How Zevanta Digital Helps Your Business
Zevanta Digital helps businesses build AI dashboards that connect insight to action. First, the team identifies the executive decisions that need better visibility. Next, data sources are reviewed for quality, access, and usefulness. Then the dashboard is designed around focused KPIs, plain-language AI summaries, forecasts, alerts, role-based views, and action tracking.
This approach keeps the dashboard practical. Instead of creating another complex report, Zevanta Digital can help build a leadership view that supports meetings, accountability, and faster decisions. Businesses can use the contact page to discuss which executive dashboard use case would create the clearest value first.
What to Measure After Launch
Dashboard success should not be measured only by design quality. The better question is whether executives use it to make decisions. Useful metrics include login frequency, meeting usage, time saved on reporting, number of actions assigned, action completion rate, forecast accuracy, issue response time, and leadership satisfaction.
Over time, the dashboard should also show business impact. For instance, a leadership team may reduce churn, improve cash flow planning, speed up response to delivery risk, or increase sales focus. Once the dashboard improves one decision cycle, the business can expand it to additional departments and workflows.
Final Thoughts
AI dashboards are most successful when they respect executive time. Leaders need fewer distractions, clearer context, and faster paths from insight to action. Therefore, the dashboard should not be treated as a visual reporting project only. It should become part of how the company reviews performance, spots risk, assigns ownership, and improves decisions.
For growing businesses, the smartest starting point is one leadership meeting or one decision cycle. Build the dashboard around that moment, measure whether it improves the conversation, and then expand from there. In the long run, AI dashboards that executives actually use are the ones that make leadership simpler, sharper, and more accountable.
Frequently Asked Questions
What are AI dashboards?
AI dashboards are reporting and analytics views that use artificial intelligence to summarize data, detect unusual changes, forecast outcomes, explain patterns, and support decisions.
Why do executives ignore many dashboards?
Executives ignore dashboards when they are cluttered, too detailed, hard to interpret, disconnected from decisions, or missing clear ownership and next steps.
What should an executive AI dashboard include?
It should include focused KPIs, trend explanations, risk alerts, forecasts, plain-language summaries, action owners, and links to deeper details when needed.
How are AI dashboards different from BI dashboards?
BI dashboards usually visualize data and historical performance. AI dashboards add summaries, anomaly detection, forecasts, recommendations, and decision support on top of the visual data.
Can AI dashboards connect to existing business tools?
Yes. AI dashboards can connect to CRMs, finance systems, support tools, marketing platforms, operations systems, spreadsheets, and databases through integrations.
How should a business start building AI dashboards?
Start with one executive decision, choose the few KPIs that support it, connect trusted data, add AI summaries, link insights to actions, and measure adoption.
How can Zevanta Digital help my business?
Zevanta Digital can help map executive decisions, connect data sources, design AI dashboards, add automation workflows, create role-based views, and measure dashboard impact.